Candlestick Chart Patterns Technical Analysis
Descrição de Candlestick Chart Patterns Technical Analysis
Candlesticks are graphical representations of price movements for a given period of time. They are commonly formed by the opening, high, low, and closing prices of a financial instrument.
If the opening price is above the closing price then a filled (normally red or black) candlestick is drawn.
If the closing price is above the opening price, then normally a green or a hollow candlestick (white with black outline) is shown.
The filled or hollow portion of the candle is known as the body or real body, and can be long, normal, or short depending on its proportion to the lines above or below it.
The lines above and below, known as shadows, tails, or wicks represent the high and low price ranges within a specified time period. However, not all candlesticks have shadows.
Candlestick patterns are widely used in technical analysis.
Big Black Candle
Big White Candle
Black Body
Doji
Dragonfly Doji
Gravestone Doji
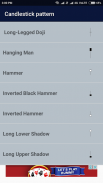
Long-Legged Doji
Hanging Man
Hammer
Inverted Black Hammer
Inverted Hammer
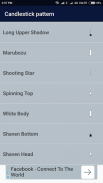
Long Lower Shadow
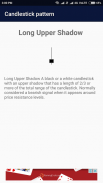
Long Upper Shadow
Marubozu
Shooting Star
Spinning Top
White Body
Shaven Bottom
Shaven Head
Bearish Harami
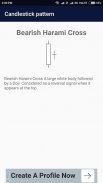
Bearish Harami Cross
Bearish 3-Method Formation
Bullish 3-Method Formation
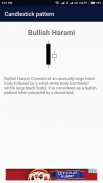
Bullish Harami
Bullish Harami Cross
Dark Cloud Cover
Engulfing Bearish Line
Engulfing Bullish
Evening Doji Star
Evening Star
Falling Window
Morning Doji Star
Morning Star
On Neckline
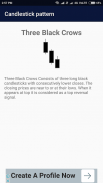
Three Black Crows
Three White Soldiers
Tweezer Bottoms
Tweezer Tops
Doji Star
Piercing Line
Rising Window
Candlestick Chart Patterns Technical Analysis - Versão 1.0
(20-09-2018)Candlestick Chart Patterns Technical Analysis - Informação APK
Versão APK: 1.0Pacote: com.oti.ip.candlestickÚltima Versão de Candlestick Chart Patterns Technical Analysis


 4.83
4.83


Apps na mesma categoria